Abstract
About 5%–10% of pregnancies in the US are exposed to cannabis with highest use reported during the first trimester. Two recent meta-analyses presented estimates of the risk of birth defects associated with prenatal exposure to cannabis; the larger and more recent meta-analysis pooled data from 18 cohort and 18 case-control studies with a total sample size of >19 million subjects. The meta-analyses found that prenatal exposure to cannabis was associated with a small but statistically significant increased risk of any birth defect (pooled odds ratios [ORs], 1.25–1.33); ORs were also significantly elevated for cardiovascular, gastrointestinal, nervous system, genitourinary, and musculoskeletal but not orofacial birth defects. The ORs were smaller and less likely to be statistically significant in adjusted analyses. These meta-analyses had strengths but also shortcomings. The strengths and shortcomings are explained in detail so that readers obtain a better understanding of how to critically assess findings in meta-analyses. One strength was the presentation of both unadjusted and adjusted pooled estimates; the former allow an understanding of risks in the average real world patient and the latter allow an understanding of the unique contribution of the exposure to the outcomes. Another strength was the presentation of cumulative meta-analyses which demonstrated from which calendar year onwards a finding became consistently statistically significant in the scientific literature. One shortcoming, in analyses of subcategories of birth defects, was the repeated representation of the same sample in the same forest plot; the many reasons why this is problematic are explained. Another shortcoming was the pooling of ORs obtained from cohort studies with those obtained from case control studies; conceptual and numerical reasons why this is problematic are also explained.
J Clin Psychiatry 2024;85(4):24f15673
Author affiliations are listed at the end of this article.
An earlier article in this column examined epidemiological trends in the use of cannabis and maternal and neonatal outcomes associated with gestational exposure to cannabis. In brief, cannabis use is rising in the general population, including in women of reproductive age. About 5%–10% of pregnancies are exposed to cannabis. Constituents of cannabis can affect the outcome of pregnancy in many ways, such as by acting on cannabinoid receptors in the placenta and in the developing fetal brain. Adverse maternal outcomes include increased risk of gestational hypertension, too little or too much gestational weight gain, and placental abruption. Adverse neonatal outcomes include increased risk of preterm birth, small for gestational age, low birth weight, admission to the neonatal intensive care unit, and fetal death.1 This article presents 2 recent meta analyses of studies on birth defects associated with gestational exposure to cannabis.2,3 This article also examines the strengths and limitations of these meta analyses with a view to provide the reader with a deeper understanding of how to read and critically assess papers that describe meta-analyses.
The 2023 Meta-Analysis
Delker et al2 described a systematic review and meta analysis of the risk of major structural birth defects associated with prenatal exposure to cannabis. These authors searched electronic databases and reference lists and identified 23 studies that met their search criteria. These studies had been published between 1983 and 2022 and contained data for the birth years 1968–2021. There were 18 studies from the US, 3 from Canada, and 1, each, from Spain and Norway. The 23 studies comprised 11 cohort studies, 9 case-control studies, and 3 cross sectional studies.
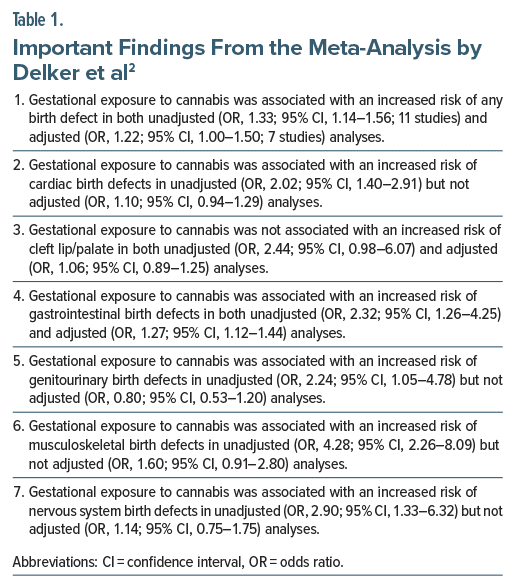
Important findings from this meta-analysis2 are presented in Table 1. In summary, in all analyses there were many more studies that provided unadjusted estimates than adjusted estimates. In unadjusted analyses, gestational exposure to cannabis was associated with increased risk of any birth defect as well as increased risk of cardiac, gastrointestinal, genitourinary, musculoskeletal, and nervous system but not cleft lip/palate defects. In adjusted analyses, gestational exposure to cannabis was associated with increased risk of only any birth defect and gastrointestinal birth defects.
Almost all analyses were characterized by high heterogeneity, and in almost all analyses heterogeneity was greater in unadjusted than in adjusted analyses. Subgroup analyses to explore heterogeneity were not conducted.
No analyses were presented for only first trimester exposure and only second/third trimester exposure; these analyses could have helped control for confounding because congenital malformations are generally associated with first trimester exposure. The influence of calendar year was not examined; this analysis would have been important because quality of data ascertainment, toxicity of cannabis used, and confounding variables associated with greater availability of cannabis could have changed across time.
The 2024 Meta-Analysis
Tadesse et al3 described a systematic review and meta analysis of the risk of congenital birth defects associated with prenatal cannabis use. These authors searched electronic databases and reference lists and identified 18 cohort and 18 case-control studies (pooled N=19,049,013), published between 1983 and 2023, that met their search criteria. Of these studies, 25 had been conducted in the US, 5 in Canada, 3 in the UK, and 1 each in France, Spain, and Norway. Only 21 studies presented adjusted analyses.
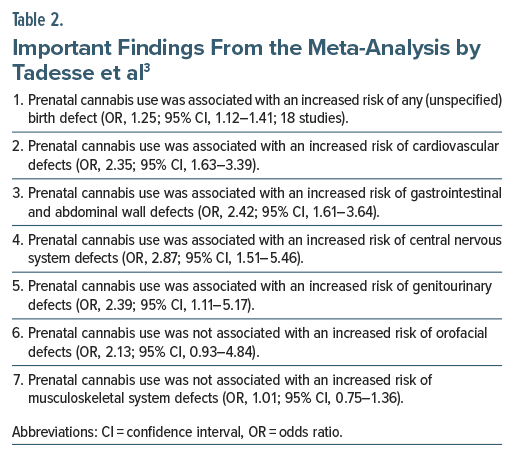
Important findings from this meta-analysis3 are presented in Table 2. In summary, prenatal cannabis use was associated with an increased risk of any birth defect, cardiovascular defects, gastrointestinal and abdominal wall defects, central nervous system defects, and genitourinary defects, but not orofacial and musculoskeletal defects. Heterogeneity was high to very high in most analyses. There was no evidence of publication bias.
Interestingly, in separate meta-analyses that cumulated the effect size, study by study, with studies added chronologically to the forest plot, the increased risk of birth defects was evident from around 1990 but became consistently statistically significant only from 2018. For gastrointestinal/abdominal wall and cardiovascular defects, the risk was consistently and significantly elevated much earlier; that is, from 1994 and 2006, respectively.
In subgroup analyses, risks for any birth defect and specific organ system birth defects were mostly higher in unadjusted than in adjusted analyses, in cohort than in case-control studies, and after first trimester exposure than after second or third trimester exposure. The authors stated (in their abstract, methods section, and discussion section) that they performed meta-regression analysis but did not present the results in either the main paper or in supplementary materials.
Strengths and Shortcomings
The two meta-analyses2,3 had strengths and shortcomings. There were 2 notable strengths. One was the presentation of both unadjusted and adjusted pooled estimates in the 2023 meta-analysis.2 The other was the presentation of chronologically cumulated odds ratios (ORs) in forest plots in the 2024 meta-analysis.3 There were 2 notable shortcomings in both meta-analyses. One was the pooling of individual malformations from the same study, resulting in repeated representations of the same sample in the same forest plot. The other was the pooling in the same forest plot of ORs from cohort studies with ORs from case-control studies.
Each of these strengths and shortcomings is considered in turn. Although not essential, readers will benefit more if they examine the full text of the meta analyses2,3 as they follow the discussion in the rest of this article. Whereas the 2023 meta-analysis2 is behind a paywall, the 2024 meta-analysis3 is available open access and would suffice for reference.
Readers who are unfamiliar with measures of effect size, 95% confidence intervals (CIs), and meta-analysis, itself, might wish to learn about these from previous articles in this column4–7 before proceeding with the remainder of this article.
Strength: Presentation of Both Unadjusted and Adjusted Pooled Estimates
Delker et al2 presented both unadjusted and adjusted pooled estimates. Tadesse et al3 pooled whatever estimates were available, whether unadjusted or adjusted (thus, their forest plots were mixed); however, they did present a subgroup analysis of only unadjusted and only adjusted estimates.
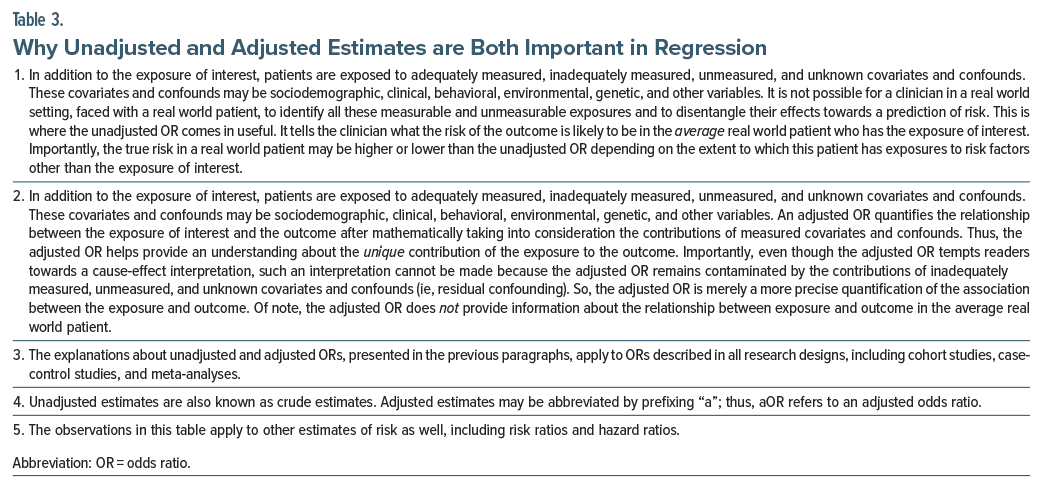
It is useful for readers to know both unadjusted and adjusted values. This is because an unadjusted estimate quantifies the relationship between the exposure and the outcome in the average patient in a real world setting whereas an adjusted estimate quantifies the unique contribution of the exposure to the outcome. The concepts are explained in greater detail in Table 3.
Applying the explanations in Table 3 to the findings of Delker et al2 in Table 2, we now understand that if we are assessing a woman who has used cannabis during her current pregnancy, there is an approximately doubled risk of a cardiac birth defect in her child (unadjusted OR, 2.02; 95% CI, 1.40–2.91); however, cannabis use, per se, does not appear to drive this risk (adjusted OR, 1.10; 95% CI, 0.94–1.29). Thus, unadjusted and adjusted estimates are both useful when providing guidance, weighing options, and making treatment plans.
Strength: Presentation of Chronologically Cumulated Plots
In the forest plot of a cumulative meta-analysis, studies are arranged from top to bottom in chronological order, and the effect size presented for a study represents not the effect size of that study but the effect size of that study pooled with the effect sizes of all the previously published studies. So, a cumulative meta-analysis is a historical forest plot with studies being added to the existing meta-analysis as and when they are published.
A cumulative meta-analysis tells us when a finding became statistically significant, if indeed it did. For example, Lau et al8 presented a cumulative meta analysis of the benefit of intravenous streptokinase in patients with acute myocardial infarction. They showed that a consistent, statistically significant decrease in total mortality was evident in 1973, itself, after only 8 trials (pooled N = 2,432) had been completed. However, 25 additional trials (pooled N = 34,542) were conducted, including 2 very large trials (n = 11,712 and 17,187), all of which merely narrowed the 95% CI without much changing the value of the pooled estimate.
In this context, Tadesse et al3 presented cumulative meta-analyses for any (unspecified) birth defects as well as for birth defects grouped by organ systems. As an example, they showed that gestational exposure to cannabis was associated with clear and consistent increase in the risk of gastrointestinal and abdominal wall defects as early as in 1994, and in the risk of cardiovascular defects as early as in 2006.
On an unrelated note, chronological ordering of studies in a forest plot without cumulative meta-analysis (so, actual effect sizes are presented, as in conventional plots) can provide an understanding of time trends. This can be useful if methods for diagnosis and treatment change across time, or, in the context of this article, if the potency of cannabis available and parameters related to its use change across time.
Shortcoming: Multiple Representations of the Same Sample in the Same Forest Plot
Both meta-analyses2,3 combined various outcomes from the same study in the same forest plots as though these outcomes had been obtained from different studies. The best way to understand why this is a problem is to use a simplification. Table 4 displays a small section of data, describing only 6 out of many specific cardiac defects, all obtained from a single study,9 and extracted from a single forest plot that was presented as Figure 3 in the 2023 meta-analysis.2 Readers will readily recognize that the rows of data were obtained from the same sample because the sample sizes for exposed and unexposed subjects, shown in columns 3 and 5 in Table 4, are identical across rows.
There are 5 reasons why these multiple representations of the same sample are problematic. First, meta-analysis is performed to pool estimates of the same outcome as obtained from different studies, and not estimates of different outcomes as obtained from the same study. Second, when the same sample is represented many times in the same forest plot, readers who do not spot this wrongly assume that the pooled sample was much larger than it actually was, creating a false impression of value associated with larger sample size. Third, even though the different rows of data in the forest plot were obtained from the same study, the meta-analysis software treats the data as though they had been obtained from different studies; as a result, the 95% CI becomes much narrower than it ought to be. That is, a false impression of precision is created. Fourth, multiple representation of the same sample in the same forest plot amplifies the biases in that study relative to the biases in the other studies in that forest plot. Fifth, when absolute risks in exposed and unexposed samples are examined, because each representation of the sample presents an estimate for a subcategory of the outcome, both absolute risks appear smaller than they ought to be for that main category of birth defect.
The same forest plot in the Delker et al2 meta-analysis also presented 6 rows of cardiac birth defect data from the same sample of another study,10 and that forest plot pooled, in total, 24 effect sizes from 9 studies. Of these, 16 were multiple representations of the same samples, obtained from just 2 studies.
Multiple representations of the same sample were evident in the forest plots in the 2024 meta-analysis,3 as well; in fact, in the cardiovascular defects forest plot, the Forrester and Merz9 sample was represented 9 times. In these 2 meta-analyses,2,3 only the forest plots for “any birth defect” were uncontaminated by repeated representations of the same samples. Therefore, these were possibly the only forest plots with trustworthy findings in the 2 meta-analyses.2,3
Shortcoming: Combining Estimates From Cohort Studies With Those From Case-Control Studies
The 2023 and 2024 meta-analyses2,3 each combined ORs obtained from cohort studies with those obtained from case-control studies. In section 24.6.2.3 of the Cochrane Handbook for Systematic Reviews of Interventions, authors are discouraged from combining results obtained from different study designs11; an example is provided of a forest plot that presented data separately for cohort, case-control, and cross-sectional studies without combining them into a single pooled estimate.12 The Cochrane Handbook does not provide a reason for its recommendation, but here is an explanation.
Cohort studies identify groups with and without an exposure of interest and compare the risk of an outcome between these exposure groups. For example, a cohort study may follow women who did vs did not use cannabis during pregnancy (exposure groups) to determine the risk of birth defects in their offspring (outcome). In contrast, case-control studies identify groups with and without an outcome of interest and compare the risk of the exposure between these outcome groups. For example, a case-control study may assess offspring with vs without birth defects to determine whether or not they had been exposed to maternal cannabis use during pregnancy. Readers who wish to learn more about these research designs may refer to primers on the subject.13,14
So, cohort and case-control studies both examine the association between an exposure and an outcome. However, the questions that they answer are manifestly different. An OR obtained from logistic regression in a cohort study might tell us that an outcome is more likely when the exposure is present. In contrast, an OR obtained from logistic regression in a case-control study might tell us that an exposure is more likely if the outcome is present. This, by itself, suggests that pooling ORs obtained from cohort and case-control studies is not appropriate because the ORs are conceptually different. Apples and oranges should not be averaged.
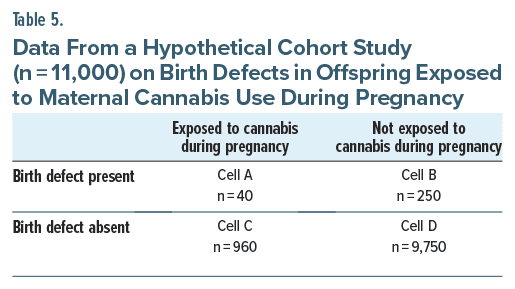
A reader may think that in both study designs the row and column variables are the same; so why can’t ORs from cohort and case-control studies be pooled? Consider data from a hypothetical cohort study (n = 11,000), presented in Table 5. Now, in a cohort study, the starting point is the exposure. In this cohort, 10% of women (n = 1,000) used cannabis during pregnancy and 4% of their offspring (n = 40) had birth defects. Among the offspring of the 10,000 women who did not use cannabis during pregnancy, 2.5% (n = 250) had birth defects. We can now calculate the relative risk of birth defects associated with gestational exposure to cannabis; or, we can use logistic regression to adjust for covariates and confounds and obtain an OR for the risk of birth defects associated with gestational exposure to cannabis. In this example of an OR obtained from a cohort study, we know how many women did vs did not use cannabis in pregnancy and how many of their offspring did vs did not have birth defects.
Let us now take exactly the same cohort and imagine that we’re doing a case-control study, instead. In a case control study, the starting point is the outcome. We identify 290 offspring with birth defects (Table 5, Cells A+ B). We interview the mothers and study their case records to determine how many of these 290 offspring had been gestationally exposed to cannabis. We find that 40 vs 250 had vs did not have this exposure. We put these numbers into Cells A and B in Table 5 and our numbers are the same as those for the cohort study. So far, so good.
In case-control studies, cases, defined as subjects with the outcome, are commonly matched with controls, defined as subjects without the outcome. Matching may be 1:1 or, sometimes, 1:2 or 1:10 or whatever ratio is convenient, given the resources available. Matching may be based on a few key variables such as calendar year, maternal age, offspring sex, etc. Controls are selected in this manner because we do not know that there is a well-defined cohort from which we can draw controls (had we known this, we’d probably have used a retrospective cohort study design and not a case-control study design). So, for our 290 cases, we select 290, 580, 2,900 (or whatever) matched controls from the pool of offspring to which we have access. Then, we ascertain maternal use of cannabis during pregnancy among these controls to populate Cells C and D in Table 5. The values for Cells C and D in this case-control study will be completely different from the values in the cohort study.
In other words, even though the row and column headings of Table 5 are the same for cohort and case control designs, we will obtain different OR values for the relationship between exposure and outcome depending on whether the study was a cohort study or a case-control study. So, the ORs are not only conceptually different, as explained earlier, but also numerically different between cohort and case-control studies, which is why pooling them is not a good idea.
Take-Home Messages
Gestational exposure to cannabis is associated with a small but statistically significant increase in the risk of birth defects in offspring; given the methodological limitations of the meta-analyses2,3 examined, more nuanced interpretations are inadvisable. Whereas conclusions about cause and effect cannot be drawn, it would be wise for women to avoid cannabis use during pregnancy, especially given that gestational exposure to cannabis has also been associated with increased risk of maternal adverse outcomes, neonatal adverse outcomes, and neurodevelopmental disorders.1,15–17
Authors who perform meta-analysis could consider presenting both unadjusted and adjusted estimates, and cumulative plots where there is a sufficient number of studies distributed across a sufficiently wide time span. A sample should not be represented more than once in the same forest plot. Estimates from different study designs should not be pooled.
Article Information
Published Online: November 20, 2024. https://doi.org/10.4088/JCP.24f15673
© 2024 Physicians Postgraduate Press, Inc.
To Cite: Andrade C. Towards a further understanding of meta-analysis using gestational exposure to cannabis and birth defects as a case in point.
J Clin Psychiatry. 2024;85(4):24f15673.
Author Affiliations: Department of Psychiatry, Kasturba Medical College, Manipal Academy of Higher Education, Manipal, India; Department of Clinical Psychopharmacology and Neurotoxicology, National Institute of Mental Health and Neurosciences, Bangalore, India ([email protected]).
Relevant Financial Relationships: None.
Funding/Support: None.
References (17)

- Andrade C. Maternal cannabis use during pregnancy and maternal and neonatal adverse outcomes. J Clin Psychiatry. 2024;85(4):24f15611. PubMed CrossRef
- Delker E, Hayes S, Kelly AE, et al. Prenatal exposure to cannabis and risk of major structural birth defects: a systematic review and meta-analysis. Obstet Gynecol. 2023;142(2):269–283. PubMed
- Tadesse AW, Ayano G, Dachew BA, et al. The association between prenatal cannabis use and congenital birth defects in offspring: a cumulative meta-analysis. Neurotoxicol Teratol. 2024;102:107340. PubMed CrossRef
- Andrade C. Understanding relative risk, odds ratio, and related terms: as simple as it can get. J Clin Psychiatry. 2015;76(7):e857–e861. PubMed CrossRef
- Andrade C. Mean difference, standardized mean difference (SMD) and their use in meta-analysis: as simple as it gets. J Clin Psychiatry. 2020;81(5):20f13681. PubMed CrossRef
- Andrade C. A primer on confidence intervals in psychopharmacology. J Clin Psychiatry. 2015;76(2):e228–e231. PubMed CrossRef
- Andrade C. Understanding the basics of meta-analysis and how to read a forest plot: as simple as it gets. J Clin Psychiatry. 2020;81(5):20f13698. PubMed CrossRef
- Lau J, Antman EM, Jimenez-Silva J, et al. Cumulative meta-analysis of therapeutic trials for myocardial infarction. N Engl J Med. 1992;327(4):248–254. PubMed CrossRef
- Forrester MB, Merz RD. Risk of selected birth defects with prenatal illicit drug use, Hawaii, 1986-2002. J Toxicol Environ Health A. 2007;70(1):7–18. PubMed
- van Gelder MMHJ, Donders ART, Devine O, et al. Using Bayesian models to assess the effects of under-reporting of cannabis use on the association with birth defects, national birth defects prevention study, 1997-2005. Paediatr Perinat Epidemiol. 2014;28(5):424–433. PubMed
- Reeves BC, Deeks JJ, Higgins JPT, et al. Including non-randomized studies on intervention effects. In: Higgins JPT, Thomas J, Chandler J, eds, et al. Cochrane Handbook for Systematic Reviews of Interventions. 2nd ed. Wiley-Blackwell;2019:595–620.
- Siegfried N, Muller M, Deeks JJ, et al. Male circumcision for prevention of heterosexual acquisition of HIV in men. Cochrane Database Syst Rev. 2003;15(2):CD003362.
- Andrade C. Research design: cohort studies. Indian J Psychol Med. 2022;44(2):189–191. PubMed CrossRef
- Andrade C. Research design: case-control studies. Indian J Psychol Med. 2022;44(3):307–309. PubMed CrossRef
- Tadesse AW, Dachew BA, Ayano G, et al. Prenatal cannabis use and the risk of attention deficit hyperactivity disorder and autism spectrum disorder in offspring: a systematic review and meta-analysis. J Psychiatr Res. 2024;171:142–151. PubMed CrossRef
- Sorkhou M, Singla DR, Castle DJ, et al. Birth, cognitive and behavioral effects of intrauterine cannabis exposure in infants and children: a systematic review and meta-analysis. Addiction. 2024;119(3):411–437. PubMed
- Bassalov H, Yakirevich-Amir N, Reuveni I, et al. Prenatal cannabis exposure and the risk for neuropsychiatric anomalies in the offspring: a systematic review and meta analysis. Am J Obstet Gynecol. Published online June 20, 2024. doi:10.1016/j.ajog.2024.06.014 CrossRef
This PDF is free for all visitors!
